Prepare
Practice
Interview
Aptitude
Reasoning
English
GD
Placement
HR
Current affairs
Engineering
MCA
MBA
Online Test
Videos
Login
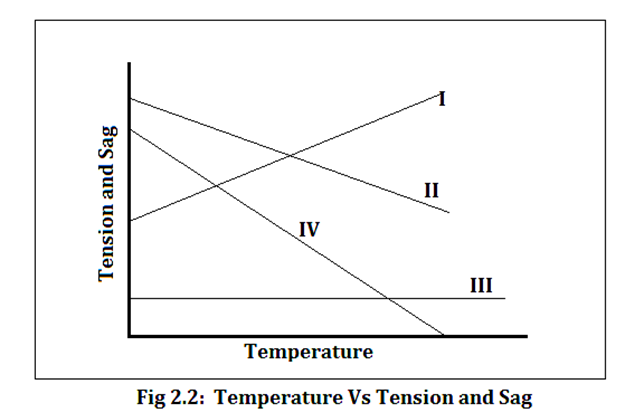
Temperature vs Tension and sag graph - Curve representing the sag
Home
>>
Category
>>
Electrical Engineering (MCQ) questions and answers
>>
Power System - Transmission and Distribution
Q. In the following graph which curve represents the sag?
- Published on 23 Nov 15
a.
I
b.
II
c.
III
d.
IV
ANSWER: I
Related Content
Basic Electrical Engineering (
170
)
Electric Power Utilization (
101
)
Power Electronics (
124
)
Electrical and Electronic Measurements & Instrumentation (
320
)
Maintenance & Testing of Electrical Equipments (
221
)
Electrical Installation, Estimation and Costing (
80
)
Electrical Audit & Management (
60
)
Power System - Analysis, Stability & Computer Techniques (
130
)
Electrical Machines (
452
)
Electrical Measurements & Units (
343
)
Switchgear & Protection (
107
)
Power systems - Generation (
182
)
Power System - Transmission and Distribution (
277
)
High Voltage Engineering (
70
)
Electrical Machine Design (
0
)
➨
Post your comment / Share knowledge
Required!
Required!
Invalid Email Id!
Required!
Enter the code shown above:
Please enter the code shown above
(Note: If you cannot read the numbers in the above image, reload the page to generate a new one.)
MCQs
English
Tutorials
Download
▲
 - Published on 23 Nov 15


