Data Warehousing
Explain the operations of OLAP.
Introduction- OLAP is known as Online Analytical Processing which was created by E.F. Codd in 1993.
- It is used to refer to a type of application that allows a user to interactively analyze data.
- Before the creation of OLAP the systems were referred to as the Decision Support Systems.
- They describe a class of applications which require multidimensional analysis of business data.
- The OLAP systems enable the managers and the analysts to rapidly and easily examine the key performance data and perform a powerful comparison and trend analysis on large volumes of data.
- These systems can be used in a wide variety of business areas like sales and marketing, financial reporting, quality tracking etc.
- They are used for any management system that requires a flexible top down view of an organization.
- It is also a method used for analyzing data in a multidimensional format often across the multiple time periods with the aim of uncovering the business information concealed within the data.
- It helps in enabling the business users to gain an insight in the business through interactive analysis of different views of the business data built up from the operation systems.
- OLAP is not a data warehousing methodology but an integral part of it.
- It provides a facility to analyze the data that is held within the data warehouse in a flexible manner.
- It can also be defined as a process of converting raw data into business information through multi-dimensional analysis.
- The OLAP application contains the logic which include
1. Multi-dimensional data selection
2. Sub-setting of data
3. Retrieval of data via the metadata layer
4. Calculation formulas.- The OLAP application is accessed via a front-end tool that uses the tables and charts to drill down or navigate through the dimensional data or aggregated measures.
Operations of OLAP
The OLAP servers are based on the multidimensional view of data.
The different operations are
1. Roll-up
By using the following ways they perform aggregation on a data cube:
a. By climbing up a concept hierarchy for a dimension.
b. By dimension reduction.
The following diagram illustrates roll-up
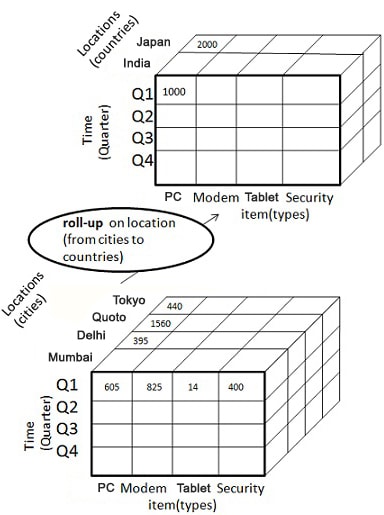
- This operation is performed by climbing up a concept hierarchy for the dimension location.
- Initially the concept use to work as “street
- The data will be aggregated on rolling up by ascending the location hierarchy from the level of city to the level of country.
- Grouping of data is done into cities rather than countries.
- One or more dimensions of the cube are removed whenever roll-up is performed.
2. Drill-down
It is the reverse operation of roll-up. They are performed by using either of the following ways:
a. By stepping down a concept hierarchy for a dimension.
b. By introducing a new dimension.
The following diagram shows how drill-down works
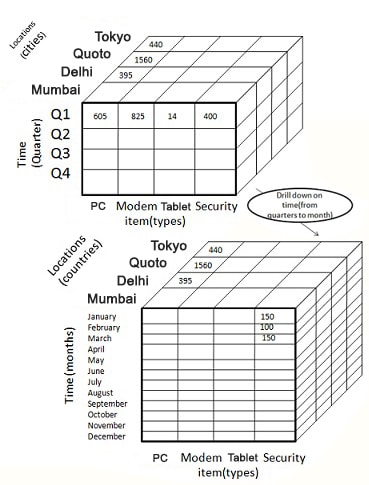
- The performance of drill-down is done by stepping down a concept hierarchy for the dimension time.
- Initially the concept use to work as “day
- Once the drilling down starts the time dimension will descend from the level of quarter to level of month.
- While performing this operation one or more dimensions from the data cube are added.
- The data is navigated from less detailed data to highly detailed data.
3. Slice- This operation provides a new sub-cube by selecting one particular dimension from a given cube.
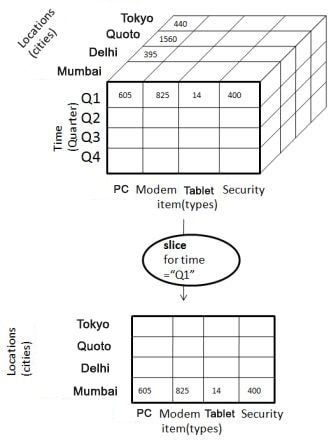
- The above diagram illustrates the working of the slice operation where the dimension “time” is using the criterion time = “Q1”.
- A new sub-cube is formed by selecting one or more dimensions.
4. Dice- This operation provides a new sub-code by selecting two or more dimensions from a given cube.
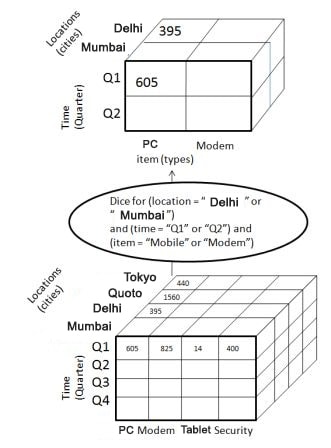
- The above diagram illustrates the dice operation on the cube based on the following selection criteria involving three dimensions:
(location = “Delhi” or “Mumbai”)
(time = “Q1” or “Q2”)
(item = “Mobile” or “Modem”)
5. Pivot- This operation is also known as rotation.
- In order to provide an alternative presentation of the data it rotates the data axes.
The diagram below illustrates the pivot operation.
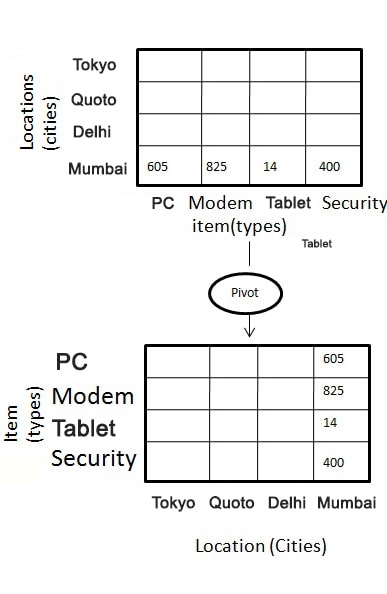
- In this operation the item and location axes in 2- D slice are rotated.
Write short notes on:
a) Snowflake Schema
b) OLAP
a) Snowflake Schema
Introduction- It is a logical arrangement of the tables in a multidimensional database in such a manner that the entity relationship diagram resembles a snowflake shape.
- This schema is represented by centralized fact tables which are connected to the multiple dimensions.
- The “Snowflaking” is one of the method of normalizing the dimension table in star schema.
- When complete normalization takes place along all the dimension tables, the resultant structure will resemble a snowflake with the fact table in between.
- The principle behind this schema is the normalization of the dimension tables by way of removing the low cardinality attributes and forming the separate tables.
- This schema is similar to that of the star schema.
- A complex shape is emerged when the dimensions of this schema elaborate, have multiple level of relationships and the child tables have multiple parent tables.
Diagram
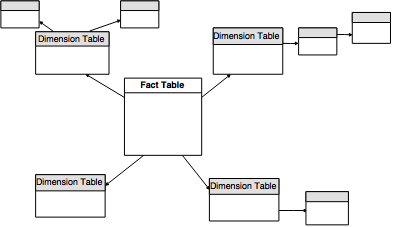
The above diagram shows the snowflake schema dimension tables are connected to a fact table and the dimension tables are again normalized into other tables.
Use- They are mostly found in the data warehouses and data marts where the speed of data retrieval is important than the efficiency of the data manipulations.
Benefits- The snowflake schema is in the same family as the star schema logical model.
- Star schema is thought through as a special case of the snowflake schema.
The advantages of snowflake schema over star schema are:- Snowflake schema are used by some of the OLAP multi-dimensional database modeling tools.
- Normalizing the attributes will result into storage savings.
Disadvantages- One of the primary disadvantage of this schema is that the additional level of attribute normalization will add complexity to the source query joins.
- The goal that is assumed by this schema is to be an efficient and compact storage of the normalized data but at the cost of poor performance while browsing the joins required in the dimension.
- When there is a comparison with the highly normalized transactional schema this schema denormalization will remove the data integrity assurances provided by the normalized schema.
- Data that is being loaded in this schema must be highly controlled and managed so as to avoid the update and insert anomalies.
b) OLAP
Introduction- OLAP is known as Online Analytical Processing which was created by E.F. Codd in 1993.
- It is used to refer to a type of application that allows a user to interactively analyze data.
- Before the creation of OLAP the systems were referred to as the Decision Support Systems.
- They describe a class of applications which require multidimensional analysis of business data.
- The OLAP systems enable the managers and the analysts to rapidly and easily examine the key performance data and perform a powerful comparison and trend analysis on large volumes of data.
- These systems can be used in a wide variety of business areas like sales and marketing, financial reporting, quality tracking etc.
- They are used for any management system that requires a flexible top down view of an organization.
- It is also a method used for analyzing data in a multidimensional format often across the multiple time periods with the aim of uncovering the business information concealed within the data.
- It helps in enabling the business users to gain an insight in the business through interactive analysis of different views of the business data built up from the operation systems.
- OLAP is not a data warehousing methodology but an integral part of it.
- It provides a facility to analyze the data that is held within the data warehouse in a flexible manner.
- It can also be defined as a process of converting raw data into business information through multi-dimensional analysis.
- The OLAP application contains the logic which include:
1. Multi-dimensional data selection
2. Sub-setting of data
3. Retrieval of data via the metadata layer
4. Calculation formulas.- The OLAP application is accessed via a front-end tool that uses the tables and charts to drill down or navigate through the dimensional data or aggregated measures.
Uses of OLAP- A lot of organizational functions use the OLAP applications.
- Finance departments use the OLAP application for budgeting,activity-based costing, financial performance analysis and financial modeling.
- Sales department use this application for sales analysis and forecasting.
- Marketing departments use it for market research analysis, sales forecasting,promotions analysis, customer analysis and market/customer segmentation.
- Manufacturing departments use it for production planning and defect analysis.
- It provides a “just-in-time” information to the managers for effective decision making.
- They enable the managers, analysts, executives to gain an insight into the data by fast, consistent, interactive access to a wide variety of possible views of information.
- OLAP transforms the data warehouse into strategic information.
Benefits of OLAP- It increases the productivity of the business managers, developers and the whole organization.
- The systems are flexible which means that they are self-sufficient.
- Enables the managers to model the problems more easily.
- The developers can deliver the application to business users faster by providing better services. The faster delivery also reduces the applications backlog.
- The IT gains more self sufficient users without relinquishing control over the integrity of data.
- It provides the IT by efficient operations. They reduce the query drag and network traffic on transaction systems.
- It enables the organization as a whole to respond more quickly to market demands. This in turn will improve the revenue and profits.
Key Features of OLAP
The features are as follows:
1. Multi-dimensional views of data- They inherently represent an actual business model.
- They provide an ability to slice and dice it provides the foundation for the analytical processing through flexible access to information.
- The managers should not have much complications in understanding the complex table layouts, elaborate table joins and the summary tables.
- It has a consistent response time.
2. Complex Calculations- The OLAP database should be able to perform complex calculations.
- It must provide a rich tool kit of powerful yet succinct computational methods.
- To make the developers more efficient and users more self-sufficient the implementation of computational methods must be clear and non-procedural.
3. Time Intelligence- Time is the integral component of almost any analytical application.
- It is a unique dimension because it is sequential in character.
- Time hierarchy is not always used in the same manner as the other hierarchies.
- They must understand the concept of balances over time.
Explain different schema in dimensional data modeling.
- The schema is a logical description of the entire database.
- The name and description of records of all the record types including all the associated data-items and aggregates are included in it.
- Just like a database a data warehouse also requires to maintain a schema.
- The database use a relational model while a data warehouse use the Star, Snowflake and Fact Constellation schema.
The schemas are explained as below:
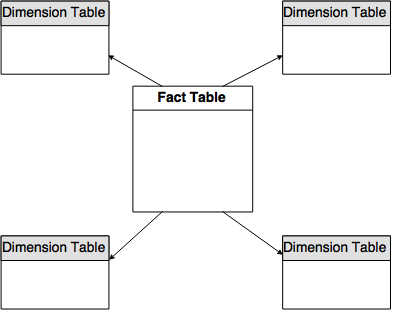
Star Schema- It is the simplest data warehouse schema.
- It is called a star schema because the entity-relationship diagram of this schema resembles a star, with points radiating from a central table.
- The center of the star consists of a large fact table and the points of the star are the dimension tables.
- A star schema is characterized by one or more very large fact tables that contain the primary information in the data warehouse, and a number of much smaller dimension tables (or lookup tables), each of which contains information about the entries for a particular attribute in the fact table.
- A star query is a join between a fact table and a number of dimension tables.
- Each dimension table is joined to the fact table using a primary key to foreign key join, but the dimension tables are not joined to each other.
- The cost-based optimizer recognizes star queries and generates efficient execution plans for them.
- A typical fact table contains keys and measures.
- A star join is a primary key to foreign key join of the dimension tables to a fact table.
Advantages of star schemas are:- They provide a direct and intuitive mapping between the business entities being analyzed by end users and the schema design.
- It provides highly optimized performance for typical star queries.
- They are widely supported by a large number of business intelligence tools, which may anticipate or even require that the data-warehouse schema contain dimension tables.
- Star schemas are used for both simple data marts and very large data warehouses.
Diagram
 Snowflake Schema
- The snowflake schema is a more complex data warehouse model than a star schema, and is a type of star schema.
- It is called a snowflake schema because the diagram of the schema resembles a snowflake.
- Snowflake schemas normalize dimensions to eliminate redundancy.
- That is, the dimension data has been grouped into multiple tables instead of one large table.
- It is a logical arrangement of the tables in a multidimensional database in such a manner that the entity relationship diagram resembles a snowflake shape.
- This schema is represented by centralized fact tables which are connected to the multiple dimensions.
- The “Snowflaking” is one of the method of normalizing the dimension table in star schema.
- When complete normalization takes place along all the dimension tables, the resultant structure will resemble a snowflake with the fact table in between.
- The principle behind this schema is the normalization of the dimension tables by way of removing the low cardinality attributes and forming the separate tables.
- This schema is similar to that of the star schema.
- A complex shape is emerged when the dimensions of this schema elaborate, have multiple level of relationships and the child tables have multiple parent tables.
Diagram
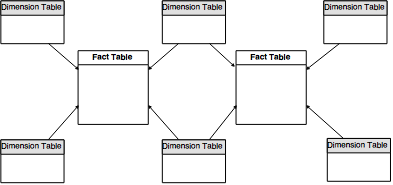
Fact Constellation Schema- It has multiple fact tables.
- It is also known as galaxy schema.
- They contain many fact tables with some common dimensions.
- It is also a combination of many data marts.
- They are segregated into independent dimensions based on the level hierarchy.
Diagram