Knowledge Base Systems and Data Mining
Describe classification. Explain any two classification algorithms with examples.
Introduction- Classification is a data- mining function that will assign items in a collection to target various categories or classes.
- Once the classification is done a prediction or decision can be taken about the data.
- It generally includes historical data.
- The goal of this is to construct a model using the historical data that will accurately predict the label of the unlabeled examples.
- A classification task generally begins by building data for which the target values are known.
- There are three different approaches that are followed by the classification model: discriminative approach, regression approach and class-conditional approach.
- A classification task begins with a data set in which the class assignments are known.
- Classifications are discrete and do not imply order.
- Continuous, floating-point values would indicate a numerical, rather than a categorical, target.
- A predictive model with a numerical target uses a regression algorithm, not a classification algorithm.
- The simplest type of classification problem is binary classification.
- In binary classification, the target attribute has only two possible values: for example, high credit rating or low credit rating.
- Multiclass targets have more than two values: for example, low, medium, high, or unknown credit rating.
- In the model build (training) process, a classification algorithm finds relationships between the values of the predictors and the values of the target.
- Different classification algorithms use different techniques for finding relationships.
- These relationships are summarized in a model, which can then be applied to a different data set in which the class assignments are unknown.
- Classification models are tested by comparing the predicted values to known target values in a set of test data.
- The historical data for a classification project is typically divided into two data sets: one for building the model; the other for testing the model.
- Scoring a classification model results in class assignments and probabilities for each case.
- For example, a model that classifies customers as low, medium, or high value would also predict the probability of each classification for each customer.
- Classification has many applications in customer segmentation, business modeling, marketing, credit analysis, and biomedical and drug response modeling.
Classification Algorithms
There are four types of algorithms provided by classification:
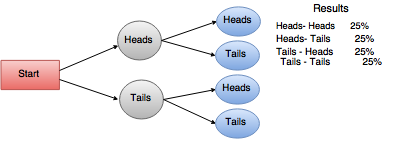
1. Decision Tree- These are the predictive models that are used to graphically organize the information about the possible options, consequences and the end values.
- Each branch of this tree is a classification question and the leaves of this tree are the partitions of the dataset with the classification.
- The outcome of the test depends upon the choice of a certain branch.
- A particular data item is classified at the start of the root node and follow the assertions down until we reach a terminal node (or leaf).
- A decision will be taken when the terminal node is approached.
- They are also interpreted as a special form of rule set that are characterized by their hierarchical organization of rules.
Diagram
 The basic algorithm can be summarized as follows:
Input
The basic algorithm can be summarized as follows:
Input- A set of training tuples and their associated class labels – Data partition D
- An attribute list of the candidates attributes.
- The attribute selection method is used which is a procedure used to determine the splitting criteria that the best partitions the data tuples into individual classes.
Output- A decision tree will the output to the above input.
Method/ Steps for creating a decision tree- A node N is created.
- If tuples in D are all of the same class C then
- N is returned as a leaf node labeled with class C
- If the list of attributes is empty then
- N is returned as a leaf node that is labeled with the majority of class in D
- By applying the attribute selection method (D, attribute list) the best splitting criterion is found.
- Node N is labeled with the splitting criterion.
- If the splitting attribute has a discrete- value and multiway splits are allowed then
- Attribute list – attribute list – splitting attribute – the splitting attribute is removed
- Each outcome j of the splitting criterion the tuples are partitioned and subtrees are grown for each partition.
- Dj will be the set of data tuples where D is satisfying the outcome of j
- Dj is empty then
- A leaf labeled with the majority class in D to node N is attached.
- Otherwise the node returned by generate decision tree (Dj, attribute list) to node N will be attached.
Endfor- N is returned.
2. Bayesian classification- It is based on the Bayes theorem.
- They are statistical classifiers.
- These classifiers help in predicting about the class membership probability which means that we can predict about the particular record to which class it belongs.
- Bayesian classifiers are acurate and give a good performance with the larger databases.
- The Naive Bayesian classifier are the class condition independent which means the effect of an attribute value on a given class is independent of the values of the other attributes.
Bayes Theorem- The Bayes theorem is named after Thomas Bayes in the 18th century.
- It provides two types of probabilities
1. Posterior Probability [P(H/X)]
2. Prior Probability [P(H)]- Here X is the data tuple and H is some hypothesis
According to the Bayes theorem it is
P(H/X) = P(X/H)P(H) / P(X)
Bayesian Network- These networks joint the probability distributions. They are also known as Belief Networks, Bayesian Networks or even Probabilistic networks.
- They allow class conditional independences to be defined between the subsets of the variable.
- A graphical model of casual relationship is provided on which learning can be performed.
- A trained Bayesian Network can be used for classification.
A Bayesian Belief Network defines two components
1. Directed acyclic graph- Each node in this graph represents a random variable.
- The variables can be continuous or discrete valued.
- The variables correspond to the actual attribute given in the data.
Graphical representation of the acyclic graph
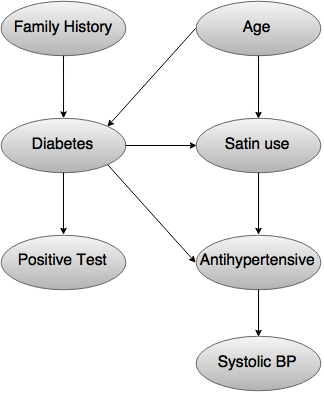
- The arc in the above diagram allows the representation of casual knowledge.
- For example, diabetes is inherited by a persons family history and even his age.
- The variable positive test is independent of whether the patient has a family history of diabetes or not or is in an age or not, given that we know that the patient has diabetes.
2. Set of conditional probability table- It allows the representation of casual knowledge.
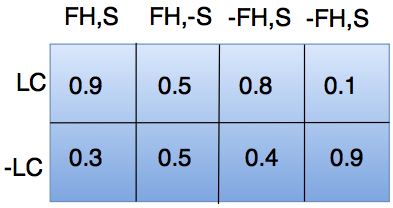
- For example, diabetes is inherited by a persons family history and even his age.
- The variable positive test is independent of whether the patient has a family history of diabetes or not or is in an age or not, given that we know that the patient has diabetes.
Write short notes on:
a) Text mining
b) Data-visualization.
Introduction- The text database consist of huge collection of databases.
- This information is collected by various means like news articles, books, digital libraries, e-mail messages, web pages, etc.
- The text databases are growing rapidly due to the increase in amount of information.
- The data is semi-structured in many of the text databases.
- Take an example of a document that contain a few structured fields, like title, author, publishing_date, etc.
- But along with this structured data, the document also contains unstructured text components, like abstract and contents.
- Without having any knowledge of what could be in the documents, it becomes difficult to formulate effective queries for analyzing and extracting useful information from the data.
- Tools are required by the users to compare the documents and rank their importance and relevance.
- Hence, text mining has become popular and an essential theme in data mining.
Information Retrieval- It deals with the retrieval of information from a large number of text-based documents.
- They can handle different kinds of data as some of the database systems are not usually present in the information retrieval systems.
- Examples of information retrieval system include:
- Online Library catalog system
- Online Document Management Systems
- Web Search Systems etc.
- The information retrieval systems main problem is to locate relevant documents in a document collection based on a user's query.
- This kind of user's query consists of some keywords describing an information need.
- In such search problems, the user takes an initiative to pull relevant information out from a collection.
- It is appropriate when the user has ad-hoc information need, i.e., a short-term need.
- The retrieval system can also take an initiative to push any newly arrived information item to the user only if the user has a need of long-term information.
- This kind of access given to the information is called Information Filtering. And the corresponding systems are known as Filtering Systems or Recommender Systems.
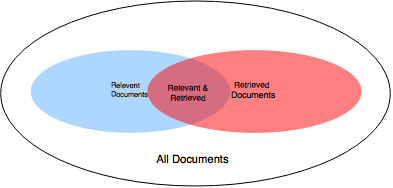
Basic Measures for Text Retrieval- The accuracy of the system is checked when a number of documents on the basis of user's input is retrieved.
- The set of documents relevant to a query is denoted as {Relevant} and the set of retrieved document as {Retrieved}.
- The set of documents which are relevant and retrieved are denoted as {Relevant} ∩ {Retrieved}.
This can be shown in the form of a Venn diagram as follows:
 The quality of text retrieval can be assessed by using three fundamental methods:
1. Precision
The quality of text retrieval can be assessed by using three fundamental methods:
1. Precision
It is the percentage of retrieved documents that are in fact relevant to the query.
It can be defined as:
Precision= |{Relevant} ∩ {Retrieved}| / |{Retrieved}|
2. Recall
It is the percentage of documents that are relevant to the query and were in fact retrieved.
It is defined as:
Recall = |{Relevant} ∩ {Retrieved}| / |{Relevant}|
3. F-score- It is commonly used as trade-off.
- The information retrieval system often needs to trade-off for precision or vice versa.
It is also defined as harmonic mean of recall or precision as follows:
F-score = recall x precision / (recall + precision) / 2
Text mining applications
The applications where text mining is used is as follows:
1. Security applications – It does the analysis of plain text sources such as the internet news. The study of text encryption is also involved.
2. Biomedical applications – One of the best example for this is PubGene which is a combination of biomedical text mining with the network visualization as an internet service.
3. Marketing applications – It is more specifically used for analytical customer relationship management.
4. Software applications – Firms like IBM are further trying to automate the mining and analysis processes in order to improve the text mining results.
5. Online media applications – It is generally used to clarify information and provide readers with greater search experiences, which in turn increases site "stickiness" and revenue. On the back end, editors are benefiting by being able to share, associate and package news across properties, significantly increasing opportunities to monetize content.
6. Sentiment analysis – It involves the analysis of movie reviews for estimating how favorable a review is for a movie.
b) Data-visualization- Data visualization is viewed as a modern equivalent way of visual communication.
- It involves the creation of the visual representation of data.
- Its primary goal is to communicate the information clearly and efficiently to the users by means of statistical graphics, plots, information graphics charts.
- It helps the decision makers to see the analytics and learn the difficult concept or identify the new pattern.
- With the help of interactive visualization for more detailing the data can be drilled down into charts and graphs.
Importance- Data visualization is important as the human brain process the information faster as charts or graphs are used to visualize large amounts of data.
- It is a quick and easy way to convey the concepts in a universal manner.
- The different scenarios can be experimented by just making slight adjustments.
- It can also help in identifying the areas which need attention or improvements.
- The factors that influence the customer behavior is clarified.
- Help to build an understanding about what products need to be placed where.
- The sales volume can be predicted.
Use of data visualization- Comprehend the information quickly
The graphical representation of the business information help to see large amount of data in a clear or cohesive way and draw the conclusions from it. The problems can be sorted out in a timely manner due to faster analysis.- Identifying the relationships and patterns
Large amount of complicated data start making sense when being presented graphically. The parameters that are highly correlated are recognized by the business. Identifying some relationships will help the organization to focus on the area that influence their goals.- Pinpointing the emerging trends
By using the data visualization for discovering trends can give the business an edge for competition and affect the bottom line. It becomes easy to spot the outliers which affect the quality of product or the customer churn and address the issues before they turn out to be bigger problems.- Communicating the story to others
once the business has uncovered the new insights from the visual analytics the next step is to communicate it to the others. By using the charts, graphs and other visually impactful representations it becomes easier to send the message across quickly.
Characteristics of an effective graphical display
The graphical display should posses the following characteristics:
- Show the data.
- It will induce the viewer for thinking about the substance rather than methodology, graphic design, the technology of graphic production or something else.
- It should avoid distorting what the data has to say.
- Many numbers should be present in a small space.
- Large data sets should be made coherent.
- The eye should be encouraged to compare different pieces of data.
- The data should be revealed at several levels of detail, from a broad overview to the fine structure.
- A reasonably clear purpose should be served: description, exploration, tabulation or decoration.
- The statistical and verbal descriptions of a data set should be closely integrated.
Diagrams used for data visualization- Bar chart
- Histogram
- Scatter plot
- Scatter plot (3D)
- Network
- Streamgraph
- Treemap
- Gantt chart
- Heat Map


