Practice Data Interpretation questions on Bar Charts, covering single and multiple bar graphs, data comparison, totals, averages, ratios, percentages, differences, and trend analysis. Takes about 20–25 minutes and is useful for placement, TCS NQT, SSC, banking and MBA entrance exams.
Question 1
Study the following bar graph carefully to answer the question that follows. Total sale of Cars and MotorBikes in six different cities: Cars -- Dehradun 5500, Gujarat 9500, Hyderabad 8500, Chandigarh 4000, Bhopal 7500, Assam 5500. MotorBikes -- Dehradun 3500, Gujarat 8500, Hyderabad 5000, Chandigarh 9500, Bhopal 4500, Assam 6500. 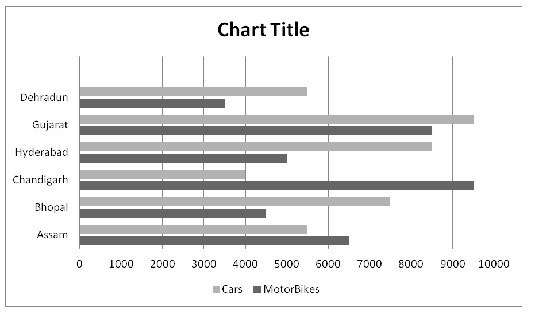 What is the average sale of Cars in all the cities together?
What is the average sale of Cars in all the cities together?
Explanation
Total Cars = 40500. Average = 405006 = 6750.
Question 2
Study the following bar graph carefully to answer the question that follows. Total sale of Cars and MotorBikes in six different cities: Cars -- Dehradun 5500, Gujarat 9500, Hyderabad 8500, Chandigarh 4000, Bhopal 7500, Assam 5500. MotorBikes -- Dehradun 3500, Gujarat 8500, Hyderabad 5000, Chandigarh 9500, Bhopal 4500, Assam 6500. The sale of Cars in cities Hyderabad and Bhopal together is approximately what percent of the sale of Cars in cities Gujarat, Assam and Dehradun together?
The sale of Cars in cities Hyderabad and Bhopal together is approximately what percent of the sale of Cars in cities Gujarat, Assam and Dehradun together?
Explanation
Cars (Hyderabad + Bhopal) = 8500 + 7500 = 16000. Cars (Gujarat + Assam + Dehradun) = 9500 + 5500 + 5500 = 20500. Required percentage = 16000 × 10020500 ≈ 78%.
Question 3
Study the following bar graph carefully to answer the question that follows. Total sale of Cars and MotorBikes in six different cities: Cars -- Dehradun 5500, Gujarat 9500, Hyderabad 8500, Chandigarh 4000, Bhopal 7500, Assam 5500. MotorBikes -- Dehradun 3500, Gujarat 8500, Hyderabad 5000, Chandigarh 9500, Bhopal 4500, Assam 6500. What is the ratio of the sale of Cars in Chandigarh to the sale of Cars in Gujarat?
What is the ratio of the sale of Cars in Chandigarh to the sale of Cars in Gujarat?
Explanation
Cars (Chandigarh) = 4000. Cars (Gujarat) = 9500. Ratio = 40009500 ≈ 0.421 ≈ 42%.
Question 4
Study the following bar graph carefully to answer the question that follows. Total sale of Cars and MotorBikes in six different cities: Cars -- Dehradun 5500, Gujarat 9500, Hyderabad 8500, Chandigarh 4000, Bhopal 7500, Assam 5500. MotorBikes -- Dehradun 3500, Gujarat 8500, Hyderabad 5000, Chandigarh 9500, Bhopal 4500, Assam 6500. The sale of MotorBikes in Assam is approximately what percentage of the total sale of MotorBikes in all the cities together?
The sale of MotorBikes in Assam is approximately what percentage of the total sale of MotorBikes in all the cities together?
Explanation
MotorBikes (Assam) = 6500. Total MotorBikes = 37500. Required percentage = 6500 × 10037500 ≈ 17.33% ≈ 17%.
Question 5
Study the following bar graph carefully to answer the question that follows. Total sale of Cars and MotorBikes in six different cities: Cars -- Dehradun 5500, Gujarat 9500, Hyderabad 8500, Chandigarh 4000, Bhopal 7500, Assam 5500. MotorBikes -- Dehradun 3500, Gujarat 8500, Hyderabad 5000, Chandigarh 9500, Bhopal 4500, Assam 6500. What is the difference between the total sale of Cars and MotorBikes in all the cities together?
What is the difference between the total sale of Cars and MotorBikes in all the cities together?
Explanation
Total Cars = 5500 + 9500 + 8500 + 4000 + 7500 + 5500 = 40500. Total MotorBikes = 3500 + 8500 + 5000 + 9500 + 4500 + 6500 = 37500. Difference = 40500 - 37500 = 3000.
Question 6
Study the following bar graph carefully to answer the question that follows. Production of milk by a company (in 1000 litres) over the years: 2007 = 450, 2008 = 750, 2009 = 850, 2010 = 600, 2011 = 700, 2012 = 400. 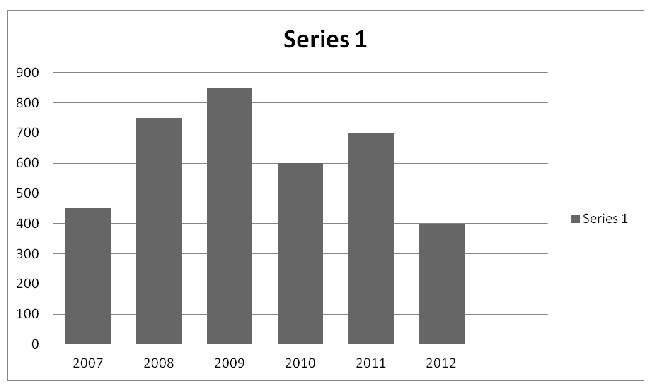 What was the percentage increase in production of milk in 2011 compared to that of 2007?
What was the percentage increase in production of milk in 2011 compared to that of 2007?
Explanation
Increase = 700 - 450 = 250. Percentage increase = 250 × 100450 ≈ 55.55%.
Question 7
Study the following bar graph carefully to answer the question that follows. Production of milk by a company (in 1000 litres) over the years: 2007 = 450, 2008 = 750, 2009 = 850, 2010 = 600, 2011 = 700, 2012 = 400. In which year was the percentage increase in production, as compared to the previous year, the maximum?
In which year was the percentage increase in production, as compared to the previous year, the maximum?
Explanation
Year-on-year percentage change: 2008 vs 2007 = (750 - 450) × 100450 ≈ 66.67%; 2009 vs 2008 ≈ 13.33%; 2010 vs 2009 is a decrease; 2011 vs 2010 ≈ 16.67%; 2012 vs 2011 is a decrease. The maximum increase is in 2008.
Question 8
Study the following bar graph carefully to answer the question that follows. Production of milk by a company (in 1000 litres) over the years: 2007 = 450, 2008 = 750, 2009 = 850, 2010 = 600, 2011 = 700, 2012 = 400. What was the percentage decline in the production of milk from 2011 to 2012?
What was the percentage decline in the production of milk from 2011 to 2012?
Explanation
Decline = 700 - 400 = 300. Percentage decline = 300 × 100700 ≈ 42.85%.
Question 9
Study the following bar graph carefully to answer the question that follows. Production of milk by a company (in 1000 litres) over the years: 2007 = 450, 2008 = 750, 2009 = 850, 2010 = 600, 2011 = 700, 2012 = 400. The average production of 2007 and 2008 was exactly equal to the average production of which of the following pairs of years?
The average production of 2007 and 2008 was exactly equal to the average production of which of the following pairs of years?
Explanation
Average of 2007 and 2008 = 450 + 7502 = 600. Checking each option: 2007 & 2011 average = 575; 2008 & 2012 average = 575; 2009 & 2010 average = 725. None equals 600; hence the answer is "None of these".
Question 10
Study the following bar graph carefully to answer the question that follows. Production of milk by a company (in 1000 litres) over the years: 2007 = 450, 2008 = 750, 2009 = 850, 2010 = 600, 2011 = 700, 2012 = 400. In how many of the given years was the production of milk more than the average production of the given years?
In how many of the given years was the production of milk more than the average production of the given years?
Explanation
Total production = 450 + 750 + 850 + 600 + 700 + 400 = 3750. Average = 37506 = 625. Years with production above 625: 2008 (750), 2009 (850) and 2011 (700) -- 3 years.
Question 11
Study the following bar graph carefully to answer the question that follows. Number of people voting from different cities: Allahabad 44000, Bhopal 130500, Chandigarh 230000, Delhi 330040, Etanagar 44210, Goa 119800. 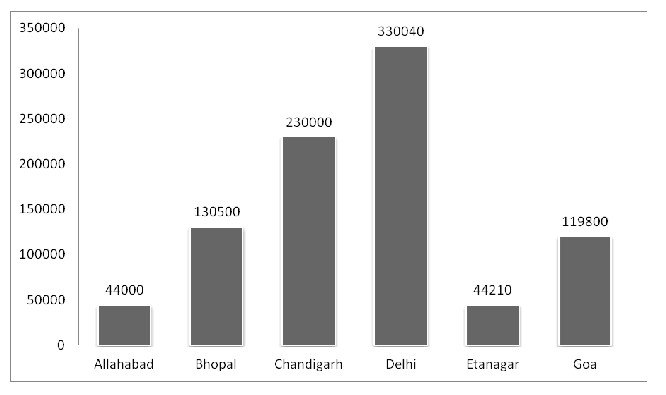 How many more people from City Goa would have made the ratio 22:17 for the number of people contributing from Goa to that from Bhopal?
How many more people from City Goa would have made the ratio 22:17 for the number of people contributing from Goa to that from Bhopal?
Explanation
Let x more people be needed from Goa. 119800 + x130500 = 2217. So, 119800 + x = 130500 × 2217 ≈ 168882.35. x ≈ 168882.35 - 119800 ≈ 49082, which does not match any of the given numeric options; hence the answer is "None of these".
Question 12
Study the following bar graph carefully to answer the question that follows. Number of people voting from different cities: Allahabad 44000, Bhopal 130500, Chandigarh 230000, Delhi 330040, Etanagar 44210, Goa 119800. What is the approximate ratio of the number of people voting from City Allahabad to that from City Delhi?
What is the approximate ratio of the number of people voting from City Allahabad to that from City Delhi?
Explanation
Ratio = 44000330040 ≈ 0.133 ≈ 18.
Question 13
Study the following bar graph carefully to answer the question that follows. Number of people voting from different cities: Allahabad 44000, Bhopal 130500, Chandigarh 230000, Delhi 330040, Etanagar 44210, Goa 119800. Approximately by what percent is the number of people voting from city Bhopal more in comparison to the number of people voting from Etanagar?
Approximately by what percent is the number of people voting from city Bhopal more in comparison to the number of people voting from Etanagar?
Explanation
Required percentage = (130500 - 44210) × 10044210 = 86290 × 10044210 ≈ 195.16% ≈ 195%.
Question 14
Study the following bar graph carefully to answer the question that follows. Number of people voting from different cities: Allahabad 44000, Bhopal 130500, Chandigarh 230000, Delhi 330040, Etanagar 44210, Goa 119800. Find the number of people voting from cities Delhi and Etanagar together forms what percent of the total number of people voting from all the given cities?
Find the number of people voting from cities Delhi and Etanagar together forms what percent of the total number of people voting from all the given cities?
Explanation
Total voters across all cities = 44000 + 130500 + 230000 + 330040 + 44210 + 119800 = 898550. Delhi + Etanagar = 330040 + 44210 = 374250. Required percentage = 374250 × 100898550 ≈ 41.65% ≈ 41%.