Practice Data Interpretation questions on Pie Charts, covering sector values, percentages, ratios, comparisons, totals, averages, and converting between angles and numerical data. Takes about 20–25 minutes and is useful for placement, TCS NQT, SSC, banking and MBA entrance exams.
Question 1
Study the following pie chart carefully to answer the question that follows. Percentage-wise breakup of employees in terms of specialisation (total employees = 16700): Mechanical 21%, Electrical 10%, Civil 32%, Electronics 21%, Instrumentation 16%. 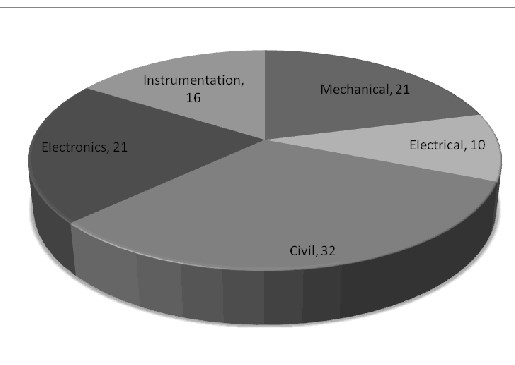 Employees having Instrumentation as specialisation form approximately what percent of employees having Civil as specialisation?
Employees having Instrumentation as specialisation form approximately what percent of employees having Civil as specialisation?
Explanation
Required percentage = 16 × 10032 = 50%.
Question 2
Study the following pie chart carefully to answer the question that follows. Percentage-wise breakup of employees in terms of specialisation (total employees = 16700): Mechanical 21%, Electrical 10%, Civil 32%, Electronics 21%, Instrumentation 16%. Employees having Electrical as specialisation are what percent of employees having Electronics as specialisation?
Employees having Electrical as specialisation are what percent of employees having Electronics as specialisation?
Explanation
Required percentage = 10 × 10021 ≈ 47.6% ≈ 47%.
Question 3
Study the following pie chart carefully to answer the question that follows. Percentage-wise breakup of employees in terms of specialisation (total employees = 16700): Mechanical 21%, Electrical 10%, Civil 32%, Electronics 21%, Instrumentation 16%. What is the total number of employees having Mechanical as specialisation?
What is the total number of employees having Mechanical as specialisation?
Explanation
Number of Mechanical employees = 21% of 16700 = 3507.
Question 4
Study the following pie chart carefully to answer the question that follows. Percentage-wise breakup of employees in terms of specialisation (total employees = 16700): Mechanical 21%, Electrical 10%, Civil 32%, Electronics 21%, Instrumentation 16%. Employees having Mechanical Engineering as specialisation are approximately what percentage of employees having Civil as specialisation?
Employees having Mechanical Engineering as specialisation are approximately what percentage of employees having Civil as specialisation?
Explanation
Required percentage = 21 × 10032 ≈ 65.6% ≈ 65%.
Question 5
Study the following pie chart carefully to answer the question that follows. Percentage-wise breakup of employees in terms of specialisation (total employees = 16700): Mechanical 21%, Electrical 10%, Civil 32%, Electronics 21%, Instrumentation 16%. What is the total number of employees having specialisation in Instrumentation, Electronics and Civil?
What is the total number of employees having specialisation in Instrumentation, Electronics and Civil?
Explanation
Instrumentation + Electronics + Civil = 16% + 21% + 32% = 69%. Number of employees = 69% of 16700 = 11523.
Question 6
Study the following pie chart carefully to answer the question that follows. Spending of an office on various expenses during a year, with the pie divided by degrees: Stationery 46°, Furniture 80°, Rent 52°, Electricity Bill 32°, Courier Expense 95°, Lunch 55°. 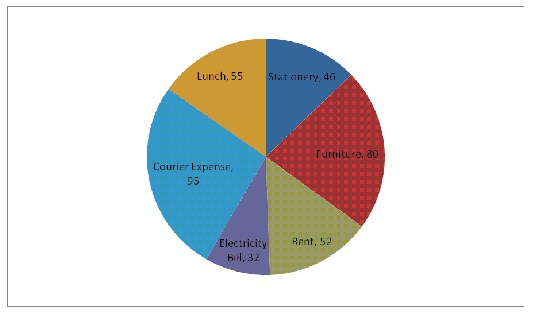 If the total amount spent by the office during the year was Rs.1,80,000, by how much does the amount spent on Courier Expense exceed that on Stationery?
If the total amount spent by the office during the year was Rs.1,80,000, by how much does the amount spent on Courier Expense exceed that on Stationery?
Explanation
Difference in degrees = 95° - 46° = 49°. Amount = 49 × 180000360 = Rs.24,500.
Question 7
Study the following pie chart carefully to answer the question that follows. Spending of an office on various expenses during a year, with the pie divided by degrees: Stationery 46°, Furniture 80°, Rent 52°, Electricity Bill 32°, Courier Expense 95°, Lunch 55°. If the total amount spent by the office during the year was Rs.2,00,000, what was the amount spent on Furniture and Courier Expense together?
If the total amount spent by the office during the year was Rs.2,00,000, what was the amount spent on Furniture and Courier Expense together?
Explanation
Furniture + Courier Expense = 80° + 95° = 175° out of 360°. Amount = 175 × 200000360 ≈ Rs.97,222.
Question 8
Study the following pie chart carefully to answer the question that follows. Spending of an office on various expenses during a year, with the pie divided by degrees: Stationery 46°, Furniture 80°, Rent 52°, Electricity Bill 32°, Courier Expense 95°, Lunch 55°. How much percent less is spent on Electricity Bill than on Furniture?
How much percent less is spent on Electricity Bill than on Furniture?
Explanation
Required percentage = (80 - 32) × 10080 = 60%, which does not match any of the given numeric options; hence the answer is "None of these".
Question 9
Study the following pie chart carefully to answer the question that follows. Spending of an office on various expenses during a year, with the pie divided by degrees: Stationery 46°, Furniture 80°, Rent 52°, Electricity Bill 32°, Courier Expense 95°, Lunch 55°. How much percent more is spent on Lunch than on Stationery?
How much percent more is spent on Lunch than on Stationery?
Explanation
Percentage more spent on Lunch than on Stationery is calculated on Stationery, which is the base.
Required percentage = (55 - 46) × 10046 = 19.57%.
Required percentage = (55 - 46) × 10046 = 19.57%.
Question 10
Study the following pie chart carefully to answer the question that follows. Spending of an office on various expenses during a year, with the pie divided by degrees: Stationery 46°, Furniture 80°, Rent 52°, Electricity Bill 32°, Courier Expense 95°, Lunch 55°. What percent of the total spending is spent on Furniture?
What percent of the total spending is spent on Furniture?
Explanation
Required percentage = 80 × 100360 ≈ 22.22%.
Question 11
Study the following pie chart carefully to answer the question that follows. Percentage-wise break-up of the spending pattern of John in a month (Total amount spent in a month = Rs.30,000): House Rent 43%, Savings 22%, Groceries 11%, Telephone Bills 12%, Health 10%, Electricity 2%. Total amount spent by John on Telephone Bills, Groceries and Electricity together forms what percent of the amount spent on House Rent?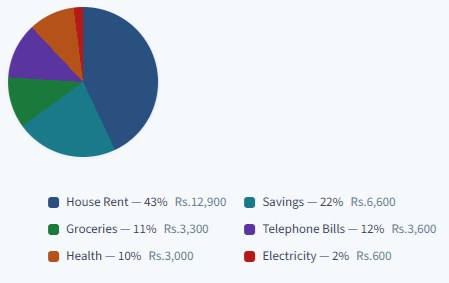
Explanation
Combined percentage for Telephone Bills, Groceries and Electricity = 12% + 11% + 2% = 25%. Amount = 25% of Rs.30,000 = Rs.7500. Amount on House Rent = 43% of Rs.30,000 = Rs.12,900. Required percentage = 7500 × 10012900 ≈ 58.13%.
Question 12
Study the following pie chart carefully to answer the question that follows. Percentage-wise break-up of the spending pattern of John in a month (Total amount spent in a month = Rs.30,000): House Rent 43%, Savings 22%, Groceries 11%, Telephone Bills 12%, Health 10%, Electricity 2%. The amount invested by John in Savings forms what ratio of the amount spent on Health?
Explanation
Amount invested in Savings = 22% of Rs.30,000 = Rs.6600. Amount spent on Health = 10% of Rs.30,000 = Rs.3000. Ratio = 6600 : 3000 = 11 : 5, which does not match any of the given ratio options; hence the answer is "None of these".
Question 13
Study the following pie chart carefully to answer the question that follows. Percentage-wise break-up of the spending pattern of John in a month (Total amount spent in a month = Rs.30,000): House Rent 43%, Savings 22%, Groceries 11%, Telephone Bills 12%, Health 10%, Electricity 2%. What is the approximate ratio of the amount spent by John on Groceries to the amount spent on House Rent?
Explanation
Amount on Groceries = 11% of Rs.30,000 = Rs.3300. Amount on House Rent = 43% of Rs.30,000 = Rs.12,900. Ratio = 3300 : 12900 = 11 : 43 ≈ 1 : 3.9 ≈ 1 : 4.
Question 14
Study the following pie chart carefully to answer the question that follows. Percentage-wise break-up of the spending pattern of John in a month (Total amount spent in a month = Rs.30,000): House Rent 43%, Savings 22%, Groceries 11%, Telephone Bills 12%, Health 10%, Electricity 2%. What is the total amount spent by John on Telephone Bills, Health and Electricity together?
Explanation
Combined percentage for Telephone Bills, Health and Electricity = 12% + 10% + 2% = 24%. Amount = 24 × 30000100 = Rs.7200, which does not match any of the given numeric options; hence the answer is "None of these".
Question 15
Study the following pie chart carefully to answer the question that follows. Percentage-wise break-up of the spending pattern of John in a month (Total amount spent in a month = Rs.30,000): House Rent 43%, Savings 22%, Groceries 11%, Telephone Bills 12%, Health 10%, Electricity 2%. What is the amount spent by John on Groceries?
Explanation
Amount spent on Groceries = 11% of Rs.30,000 = 11 × 30000100 = Rs.3300.