Practice Data Interpretation questions on Line Charts, covering line graphs, trends, comparisons, percentage changes, averages, ratios, and interpreting values across multiple time periods. Takes about 20–25 minutes and is useful for placement, TCS NQT, SSC, banking and MBA entrance exams.
Question 1
Study the following line graph carefully to answer the question that follows. Number of aspirants (in lakhs) appearing for banking exams from various institutes: Institute A = 10, B = 5, C = 3, D = 15, E = 20, F = 7. 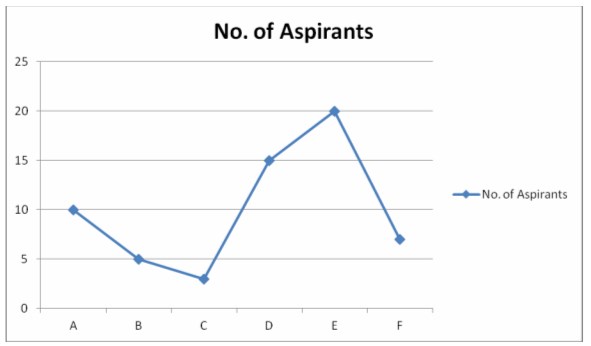
What is the ratio of the number of aspirants appearing for the banking exam from Institutes A, C and E together to the number of aspirants appearing for the exam from Institutes B, D and F together?
What is the ratio of the number of aspirants appearing for the banking exam from Institutes A, C and E together to the number of aspirants appearing for the exam from Institutes B, D and F together?
Explanation
A + C + E = 10 + 3 + 20 = 33 lakhs. B + D + F = 5 + 15 + 7 = 27 lakhs. Ratio = 3327 = 119.
Question 2
Study the following line graph carefully to answer the question that follows. Number of aspirants (in lakhs) appearing for banking exams from various institutes: Institute A = 10, B = 5, C = 3, D = 15, E = 20, F = 7. What is the ratio of the number of aspirants appearing for the banking exam from Institute C to Institute F?
What is the ratio of the number of aspirants appearing for the banking exam from Institute C to Institute F?
Explanation
Institute C = 3 lakhs, Institute F = 7 lakhs. Ratio = 37.
Question 3
Study the following line graph carefully to answer the question that follows. Number of aspirants (in lakhs) appearing for banking exams from various institutes: Institute A = 10, B = 5, C = 3, D = 15, E = 20, F = 7. What is the average number of aspirants appearing for banking exams from all the institutes together?
What is the average number of aspirants appearing for banking exams from all the institutes together?
Explanation
Total aspirants = (10 + 5 + 3 + 15 + 20 + 7) lakhs = 60 lakhs = 60,00,000. Average = 60000006 = 10,00,000.
Question 4
Study the following line graph carefully to answer the question that follows. Number of aspirants (in lakhs) appearing for banking exams from various institutes: Institute A = 10, B = 5, C = 3, D = 15, E = 20, F = 7. The number of aspirants appearing for the exam from Institute F is what percent of the total number of aspirants appearing for the exam from all the institutes together?
The number of aspirants appearing for the exam from Institute F is what percent of the total number of aspirants appearing for the exam from all the institutes together?
Explanation
Institute F = 7 lakhs. Total = 60 lakhs. Required percentage = 7 × 10060 ≈ 11.66%.
Question 5
Study the following line graph carefully to answer the question that follows. Number of aspirants (in lakhs) appearing for banking exams from various institutes: Institute A = 10, B = 5, C = 3, D = 15, E = 20, F = 7. The number of aspirants appearing for the banking exam from Institute B is approximately what percent of the number of aspirants appearing for the exam from Institute E?
The number of aspirants appearing for the banking exam from Institute B is approximately what percent of the number of aspirants appearing for the exam from Institute E?
Explanation
Institute B = 5 lakhs, Institute E = 20 lakhs. Required percentage = 5 × 10020 = 25%.
Question 6
Study the following line graph carefully to answer the question that follows. Number of employees who joined and left the company at the beginning of each year, 2007 to 2012 (initial strength in 2006 = 3000): Joined -- 2007: 2000, 2008: 3000, 2009: 5000, 2010: 2000, 2011: 6500, 2012: 500. Left -- 2007: 500, 2008: 1500, 2009: 1000, 2010: 2500, 2011: 1500, 2012: 2000. 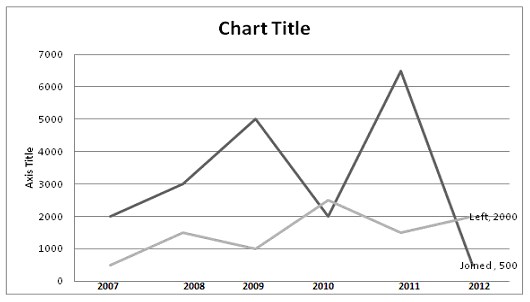 The strength of the company increased/decreased from 2007 to 2008 by approximately what percent?
The strength of the company increased/decreased from 2007 to 2008 by approximately what percent?
Explanation
Strength at end of 2007 = 3000 + 2000 - 500 = 4500. Strength at end of 2008 = 4500 + 3000 - 1500 = 6000. Percentage change = (6000 - 4500) × 1004500 ≈ 33.33% ≈ 33% increase.
Question 7
Study the following line graph carefully to answer the question that follows. Number of employees who joined and left the company at the beginning of each year, 2007 to 2012 (initial strength in 2006 = 3000): Joined -- 2007: 2000, 2008: 3000, 2009: 5000, 2010: 2000, 2011: 6500, 2012: 500. Left -- 2007: 500, 2008: 1500, 2009: 1000, 2010: 2500, 2011: 1500, 2012: 2000. The number of employees working in the company during 2009 was:
The number of employees working in the company during 2009 was:
Explanation
Strength at end of 2008 = 6000 (from the previous working). Strength at end of 2009 = 6000 + 5000 - 1000 = 10000.
Question 8
Study the following line graph carefully to answer the question that follows. Number of employees who joined and left the company at the beginning of each year, 2007 to 2012 (initial strength in 2006 = 3000): Joined -- 2007: 2000, 2008: 3000, 2009: 5000, 2010: 2000, 2011: 6500, 2012: 500. Left -- 2007: 500, 2008: 1500, 2009: 1000, 2010: 2500, 2011: 1500, 2012: 2000. During which of the following pairs of years was the strength of the employees the same?
During which of the following pairs of years was the strength of the employees the same?
Explanation
Year-end strengths: 2007 = 4500, 2008 = 6000, 2009 = 10000, 2010 = 9500, 2011 = 14500, 2012 = 13000. None of the given pairs (2007&2008, 2009&2011, 2008&2012) have equal strength; hence the answer is "None of these".
Question 9
Study the following line graph carefully to answer the question that follows. Number of employees who joined and left the company at the beginning of each year, 2007 to 2012 (initial strength in 2006 = 3000): Joined -- 2007: 2000, 2008: 3000, 2009: 5000, 2010: 2000, 2011: 6500, 2012: 500. Left -- 2007: 500, 2008: 1500, 2009: 1000, 2010: 2500, 2011: 1500, 2012: 2000. The number of employees working in the company in 2010 was what percent of the number of employees working in the company in 2012?
The number of employees working in the company in 2010 was what percent of the number of employees working in the company in 2012?
Explanation
Strength at end of 2007 = 3000 + 2000 - 500 = 4500. 2008 = 4500 + 3000 - 1500 = 6000. 2009 = 6000 + 5000 - 1000 = 10000. 2010 = 10000 + 2000 - 2500 = 9500. 2011 = 9500 + 6500 - 1500 = 14500. 2012 = 14500 + 500 - 2000 = 13000.
Required percentage = 9500 × 10013000 = 73.08%.
Required percentage = 9500 × 10013000 = 73.08%.
Question 10
Study the following line graph and answer the question.
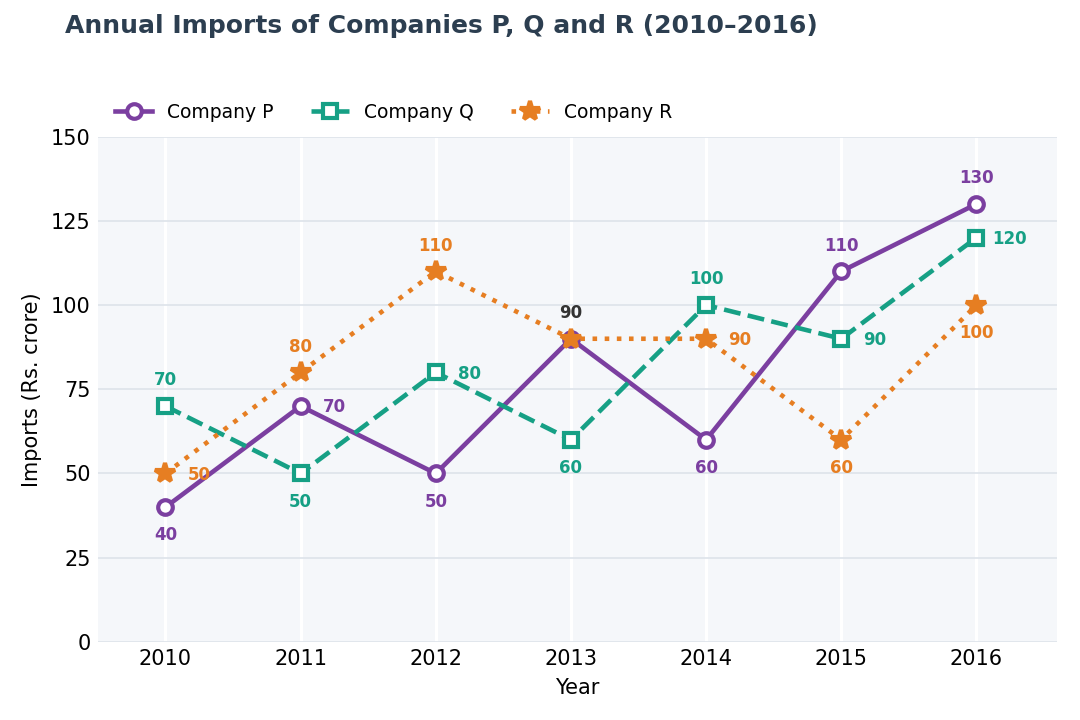
For which of the following pairs of years are the total imports of the three companies together equal?
For which of the following pairs of years are the total imports of the three companies together equal?
Explanation
Total imports of P, Q and R together in each year:
2010 = Rs. (40 + 70 + 50) crores = Rs. 160 crores
2011 = Rs. (70 + 50 + 80) crores = Rs. 200 crores
2012 = Rs. (50 + 80 + 110) crores = Rs. 240 crores
2013 = Rs. (90 + 60 + 90) crores = Rs. 240 crores
2014 = Rs. (60 + 100 + 90) crores = Rs. 250 crores
2015 = Rs. (110 + 90 + 60) crores = Rs. 260 crores
2016 = Rs. (130 + 120 + 100) crores = Rs. 350 crores
Clearly, the total imports are the same in 2012 and 2013.
2010 = Rs. (40 + 70 + 50) crores = Rs. 160 crores
2011 = Rs. (70 + 50 + 80) crores = Rs. 200 crores
2012 = Rs. (50 + 80 + 110) crores = Rs. 240 crores
2013 = Rs. (90 + 60 + 90) crores = Rs. 240 crores
2014 = Rs. (60 + 100 + 90) crores = Rs. 250 crores
2015 = Rs. (110 + 90 + 60) crores = Rs. 260 crores
2016 = Rs. (130 + 120 + 100) crores = Rs. 350 crores
Clearly, the total imports are the same in 2012 and 2013.
Question 11
Study the following line graph and answer the question.
Average annual imports of Company Q during the given period are approximately what percent of the average annual imports of Company R?
Average annual imports of Company Q during the given period are approximately what percent of the average annual imports of Company R?
Explanation
Average of Q = (1/7) × (70 + 50 + 80 + 60 + 100 + 90 + 120) = 570/7
Average of R = (1/7) × (50 + 80 + 110 + 90 + 90 + 60 + 100) = 580/7
Required percentage = (570/7) / (580/7) × 100 = 570/580 × 100 = 98.28% (approximately).
Average of R = (1/7) × (50 + 80 + 110 + 90 + 90 + 60 + 100) = 580/7
Required percentage = (570/7) / (580/7) × 100 = 570/580 × 100 = 98.28% (approximately).
Question 12
Study the following line graph and answer the question.
In which year was the difference between the imports of Companies P and Q the minimum?
In which year was the difference between the imports of Companies P and Q the minimum?
Explanation
Difference between P and Q in each year:
2010 = Rs. (70 - 40) crores = Rs. 30 crores
2011 = Rs. (70 - 50) crores = Rs. 20 crores
2012 = Rs. (80 - 50) crores = Rs. 30 crores
2013 = Rs. (90 - 60) crores = Rs. 30 crores
2014 = Rs. (100 - 60) crores = Rs. 40 crores
2015 = Rs. (110 - 90) crores = Rs. 20 crores
2016 = Rs. (130 - 120) crores = Rs. 10 crores
Clearly, the difference is minimum in 2016.
2010 = Rs. (70 - 40) crores = Rs. 30 crores
2011 = Rs. (70 - 50) crores = Rs. 20 crores
2012 = Rs. (80 - 50) crores = Rs. 30 crores
2013 = Rs. (90 - 60) crores = Rs. 30 crores
2014 = Rs. (100 - 60) crores = Rs. 40 crores
2015 = Rs. (110 - 90) crores = Rs. 20 crores
2016 = Rs. (130 - 120) crores = Rs. 10 crores
Clearly, the difference is minimum in 2016.
Question 13
Study the following line graph and answer the question.
What was the difference between the average imports of the three companies in 2010 and the average imports in 2015?
What was the difference between the average imports of the three companies in 2010 and the average imports in 2015?
Explanation
Average in 2010 = (1/3) × (40 + 70 + 50) = Rs. 160/3 crores
Average in 2015 = (1/3) × (110 + 90 + 60) = Rs. 260/3 crores
Difference = Rs. (260/3 - 160/3) crores = Rs. 100/3 crores = Rs. 33.33 crores.
Average in 2015 = (1/3) × (110 + 90 + 60) = Rs. 260/3 crores
Difference = Rs. (260/3 - 160/3) crores = Rs. 100/3 crores = Rs. 33.33 crores.
Question 14
Study the following line graph and answer the question.
In how many of the given years were the imports of Company R more than its average annual imports over the given years?
In how many of the given years were the imports of Company R more than its average annual imports over the given years?
Explanation
Average annual imports of R = (1/7) × (50 + 80 + 110 + 90 + 90 + 60 + 100) = Rs. 580/7 crores = Rs. 82.86 crores.
The imports of R are more than this in 2012, 2013, 2014 and 2016, i.e. in 4 of the given years.
The imports of R are more than this in 2012, 2013, 2014 and 2016, i.e. in 4 of the given years.