Hydrograph and Flow Duration Curve - MCQs with answers
Q1. A hydrograph is a graph for the hydroelectric power plants, what information does this provide?a. The discharge at any time during the period of consideration
b. Total volume of flow upto any time given by the area under the curve upto that time.
c. The mean run off during the period.
d. All of these
View Answer / Hide AnswerANSWER: d. All of these
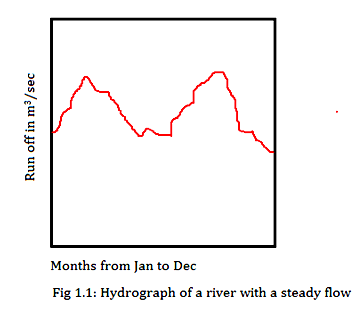
Explanation: The hydrograph is a graph which shows the variation of stream flow with respect to time for a particular river site. The time can be hour, week, month or year.
It provides the following information:
1. The discharge at any time during the period of consideration
2. Total volume of flow upto any time given by the area under the curve upto that time.
3. The mean run off during the period.
4. The maximum and minimum run off during the period
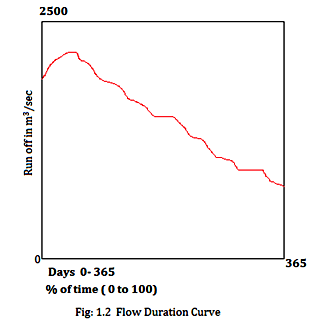
a. The total units of energy available
b. The total quality of run off during that period
c. Total power available
d. Total storage of the plant
View Answer / Hide AnswerANSWER: b. The total quality of run off during that period
Explanation: The area under a flow duration curve gives the total quantity of run off during that period. Every point on this curve shows the percentage time during the period when the flow was equal to or greater than the given flow. The difference between the monthly and the daily curves would be very small for steady streams.