Stringing Chart and Sag Template - MCQs with answers
Q1. Why is stringing chart useful?a. For finding the sag in the conductor.
b. In the design of insulator string.
c. In the design of tower
d. To find the distance between the towers.
View Answer / Hide AnswerANSWER: a. For finding the sag in the conductor.
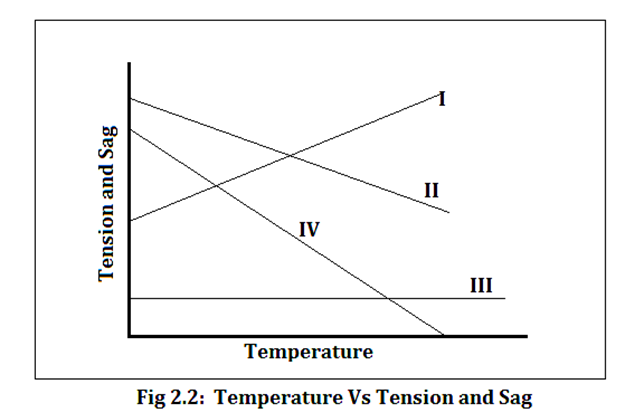 Q2. Which line represents the tension in the given graph?
a. I
b. II
c. III
d. IV
View Answer / Hide AnswerQ3. In the above graph which curve represents the sag?a. I
b. II
c. III
d. IV
View Answer / Hide AnswerQ4. Hot template curves are a plot between?a. Temperature and humidity.
b. Conductors sag and span lengths.
c. Conductor weight and sag.
d. None of the above.
View Answer / Hide AnswerANSWER: b. Conductors sag and span lengths.
a. Asymmetrical layers of ice formation.
b. Vortex phenomenon in light winds.
c. Heavy weight of the line conductors.
d. Adoption of horizontal conductor configuration.
View Answer / Hide AnswerANSWER: a. Asymmetrical layers of ice formation.
a. f
α = 2 * (V
p / d) * 1000
b. f
α = 2 * (V
p * d) * 1000
c. f
α = 2 / (V
p * d) * 1000
d. f
α = 2 / (V
p / d) * 1000
View Answer / Hide AnswerANSWER: a. fα = 2 * (Vp / d) * 1000
a. Aeoline vibrations.
b. Galloping.
c. Both (a) and (b).
d. None of these.
View Answer / Hide AnswerANSWER: c. Both (a) and (b).


